

Wireshark shows every packet your network adapter sends and receives, decoded field by field. That is a lot of detail, and the trick is knowing how to cut it down. This guide covers the handful of features you will use on almost every troubleshooting job, then applies them to four everyday problems.
Ground rules
- Capture only on your own PC and on networks you administer.
- Captures can contain private data — names, file contents, anything sent unencrypted. Store them carefully and delete them when the job is done.
- Keep captures short. Two minutes around the problem is easier to read than two hours.
Capture on your own adapter

Pick the busy interface
On the welcome screen, look for your Ethernet or Wi-Fi adapter with a moving traffic line.
Optionally set a capture filter
Type it into the “...using this filter” box before starting. Leave it empty to capture everything.
Double-click to start
Packets start scrolling in immediately.
Reproduce the problem, then stop
Open the slow app or repeat the failing step, then click the red square.
Capture filters vs display filters
Wireshark has two filter languages, and mixing them up is the most common beginner mistake.
| Capture filter | Display filter | |
|---|---|---|
| When | Set before capture starts | Applied at any time, to packets already captured |
| Where | The “...using this filter” box | The “Apply a display filter” bar above the packet list |
| Effect | Packets that do not match are never recorded | Non-matching packets are only kept out of view; clear the filter to see them again |
| Syntax | BPF, e.g. host 192.168.20.10 | Wireshark fields, e.g. ip.addr == 192.168.20.10 |
host 192.168.20.10
port 53dns
ip.addr == 192.168.20.10
tcp.port == 443
http
icmpThe display filter bar turns green when the expression is valid and red when it is not, so you know before pressing Enter. As a rule, capture broadly and narrow down with display filters: a capture filter cannot be undone afterwards.
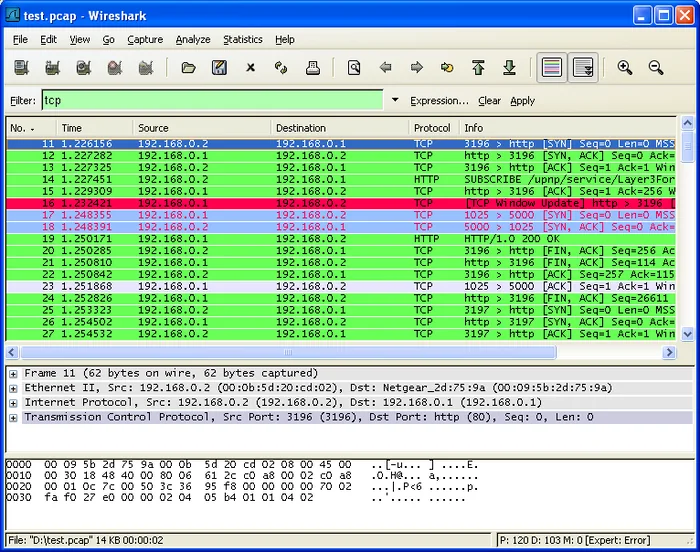
tcp applied. The colours come from the colouring rules: green for HTTP, red and black for TCP packets with problems.Reading the three panes
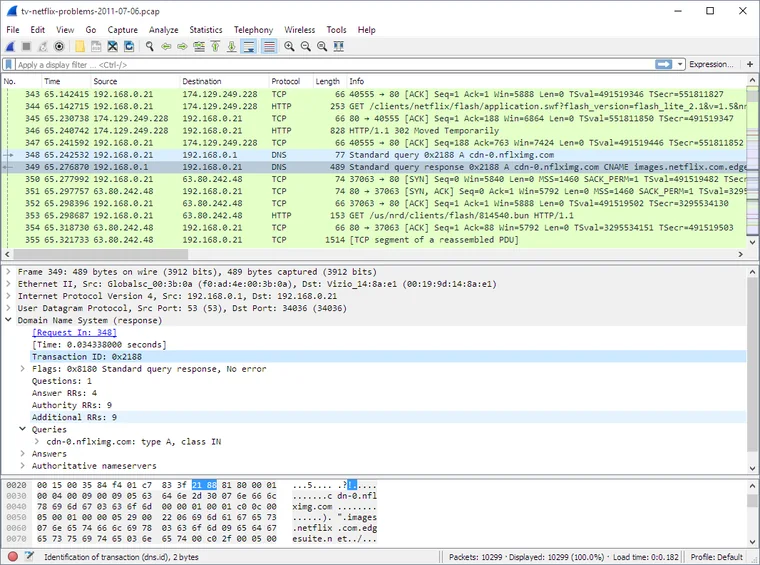
| Pane | Shows | Use it to |
|---|---|---|
| Packet list (top) | One line per packet: time, source, destination, protocol, summary | Spot patterns and pick the packet to inspect |
| Packet details (middle) | The selected packet as an expandable tree, layer by layer | Read actual values, such as the answer in a DNS reply |
| Packet bytes (bottom) | The raw bytes, with the selected field highlighted | Rarely needed; useful to see exactly where a field sits |
Names instead of numbers help readability; the name resolution options are in the View menu.
The row colours in the packet list come from colouring rules, not from severity alone. Treat them as a hint: a block of red or black rows is worth a closer look, but confirm what is going on in the details pane before you draw a conclusion. Work top to bottom — pick a row in the list, read its fields in the details, and only drop to the bytes when a field looks odd.
Follow TCP Stream
A single conversation between two programs is spread across many packets. Right-click any of them and choose Follow > TCP Stream (also under Analyze > Follow) to see the whole exchange as text.
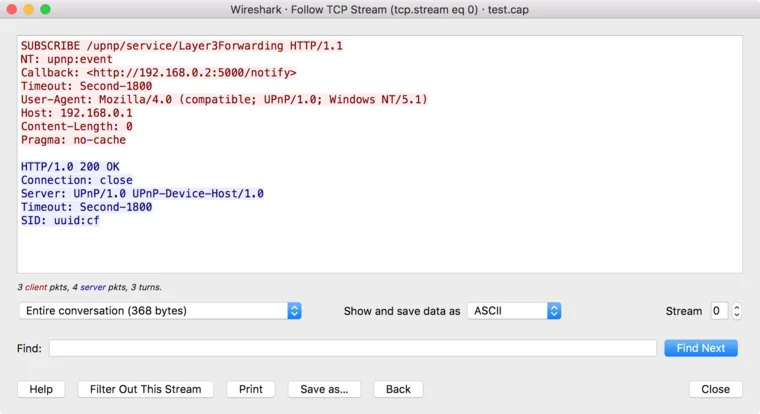
Wireshark also applies a display filter for that stream in the main window; clear the filter bar to see everything again. Traffic on port 443 is encrypted, so its stream shows unreadable data — that is expected. For plain HTTP from a printer or NAS admin page, the stream often shows the exact error message.
Statistics: who talks to whom
When you do not yet know which packets matter, the Statistics menu gives the overview.
| Menu item | Answers |
|---|---|
| Statistics > Conversations | Which pairs of addresses exchanged the most packets and bytes |
| Statistics > Endpoints | Which single hosts sent or received the most |
| Statistics > Protocol Hierarchy | What share of the traffic is DNS, HTTP, SMB and so on |
| Statistics > I/O Graphs | When traffic peaked or stopped over the capture |
| Analyze > Expert Information | Warnings Wireshark has already noticed, grouped by severity |
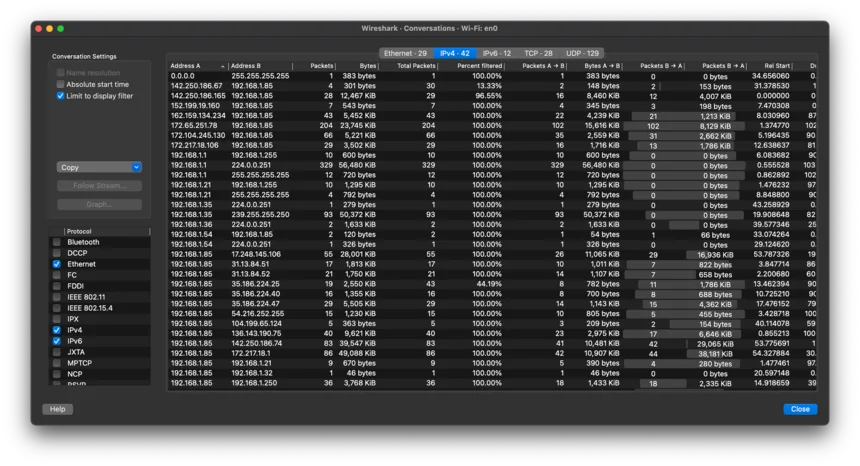
Sort Conversations by Bytes to find which host is using the bandwidth on your link.
Save and share captures
Use File > Save As and keep the default .pcapng format, for example C:\Tools\Captures\fs01-slow-2026-09-21.pcapng. To hand over only the relevant part, apply a display filter and use File > Export Specified Packets.
Troubleshooting walk-throughs
1. Names do not resolve
Users can reach 192.168.20.10 but not FS01. Start a capture, then run:
ipconfig /flushdns
nslookup FS01
Stop the capture and apply dns. Look for a query and a matching response. No response at all points to the DNS server (often the router, 192.168.20.1, on small networks) or the path to it; a response without an answer points to a missing record. The details pane shows the answer section.
2. An application is slow
Capture while you reproduce the slowness against the file server, then filter on ip.addr == 192.168.20.10. Open Analyze > Expert Information for warnings such as retransmissions, and Statistics > I/O Graphs to see whether traffic stalls. Many retransmissions suggest a network problem; a quick request followed by a long silence before the reply suggests the server itself.
3. A PC does not get an address from DHCP
Start a capture on the PC, then run:
ipconfig /release
ipconfig /renew
Apply the display filter dhcp. A healthy exchange has four messages: Discover, Offer, Request and ACK. Discovers with no Offer mean the DHCP server is not answering or not reachable from this segment; an Offer followed by no ACK points to the server’s configuration.
4. Something is using the bandwidth
When the office link feels saturated, capture for a minute on the PC where you see the slowness, then open Statistics > Endpoints and sort by bytes. Check Statistics > Protocol Hierarchy to see what kind of traffic it is, and Statistics > Conversations to find the other side. A backup to the NAS at 192.168.20.40 during working hours is a typical finding, and the fix is a schedule change rather than new hardware.
FAQ
Can I see other computers’ traffic?
On a normal switched network, your adapter mostly sees its own traffic plus broadcasts. This guide is about troubleshooting your own PC and the networks you run.
Why is my filter bar red?
The expression is not a valid display filter. Capture-filter syntax such as port 53 is a common cause; for that case, the display filter dns does the job.
Which file format should I save in?
The default, .pcapng.
Where can I learn more?
The Wireshark User’s Guide covers every menu. For setup questions, see our download page.
Download Wireshark from the official siteOpens the official Wireshark download page. We host no files.